Tutorial
This tutorial introduces you to Streambed and the Control Center, its primary data transformation and visualization tool, by creating all of the required resources to generate, transform, and visualize air temperature data from a sensor.
At the end of this tutorial you should be able to:
- Create and modify transformers
- Setup dashboards to visualize data as it is transformed
The tutorial will take about 20 minutes to complete.
Prerequisites
To complete this tutorial, the following are required:
- Streambed CLI
- Docker Compose
- Mosquitto command line tools
- Working knowledge of the JavaScript programming language
- Working knowledge of the command line
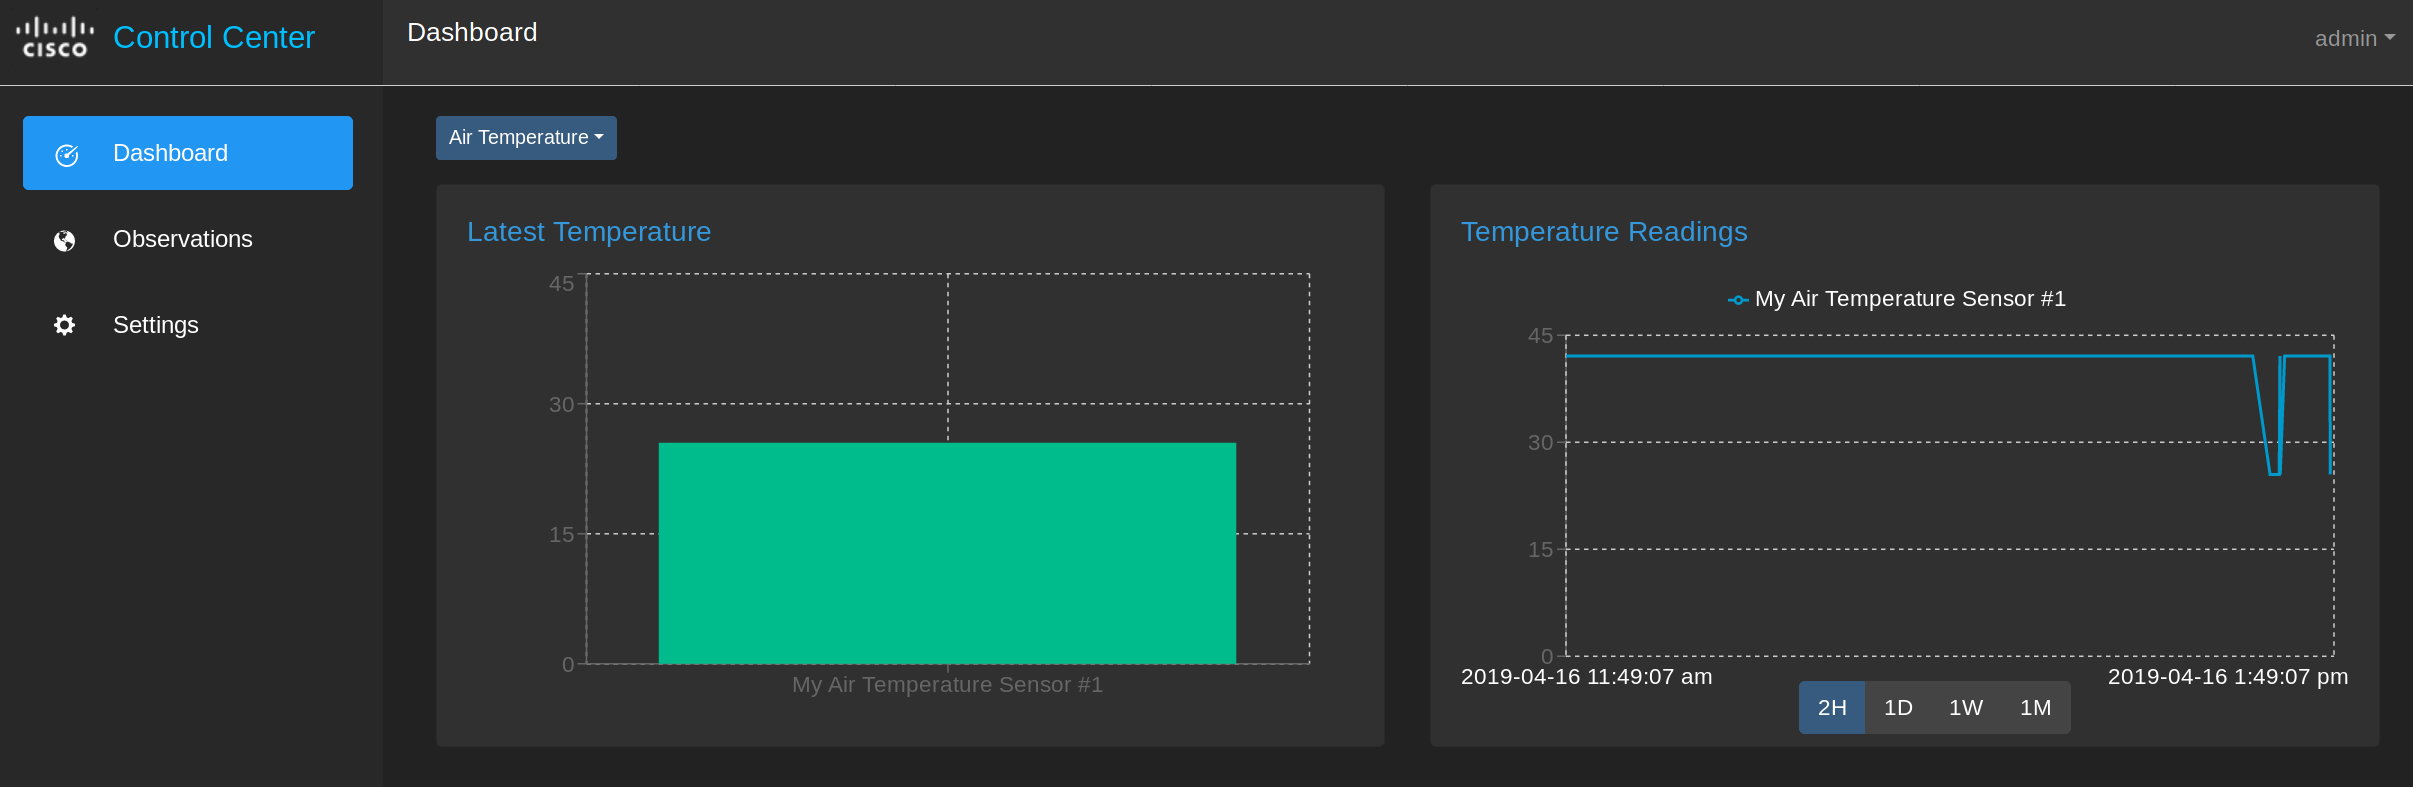
Outcome